
Scale phase:
Weeks four through twelve, roughly. This is where benchmarks matter most.
If CTR is below 0.8% for a consumer campaign in this phase, the creative is not connecting. Test new angles before adjusting budget.
Saturation phase:
The campaign has maxed out its core audience. CTR drops, CPM climbs, CPL rises together.
The fix is not tweaking. It is new creative or a new audience. Adjusting bids will not save a saturated campaign. I wrote a full guide on how to test Meta Ads creatives with AI if you need a system for this.
Recovery phase:
After pausing and relaunching. Metrics often look worse before they improve.
Week one numbers in recovery are not diagnostic. Give the algorithm time to relearn before drawing conclusions.
If your numbers are below benchmark, identify the phase first. The answer is different depending on where you are in the campaign lifecycle.
How AI Changes How You Read These Numbers
I run campaign data through Claude before making decisions now. There's a deeper breakdown of the full workflow in how AI changes Facebook ad management.
The prompt is simple: paste the campaign metrics and the relevant benchmark table. Ask Claude to flag anything meaningfully above or below, and identify which campaign phase you are likely in.
What comes back is not guesswork. It is a structured read with specific flags.
"Your CPM is 40% above Q1 average for your industry. Either audience is saturating or Q4 spend is bleeding in." That used to take 20 minutes of manual work.
Sucana does this automatically across all your campaigns. You see where each campaign stands, which phase it is in, and what the data suggests next.
Frequently Asked Questions
What is a good CTR for Facebook Ads in 2026?
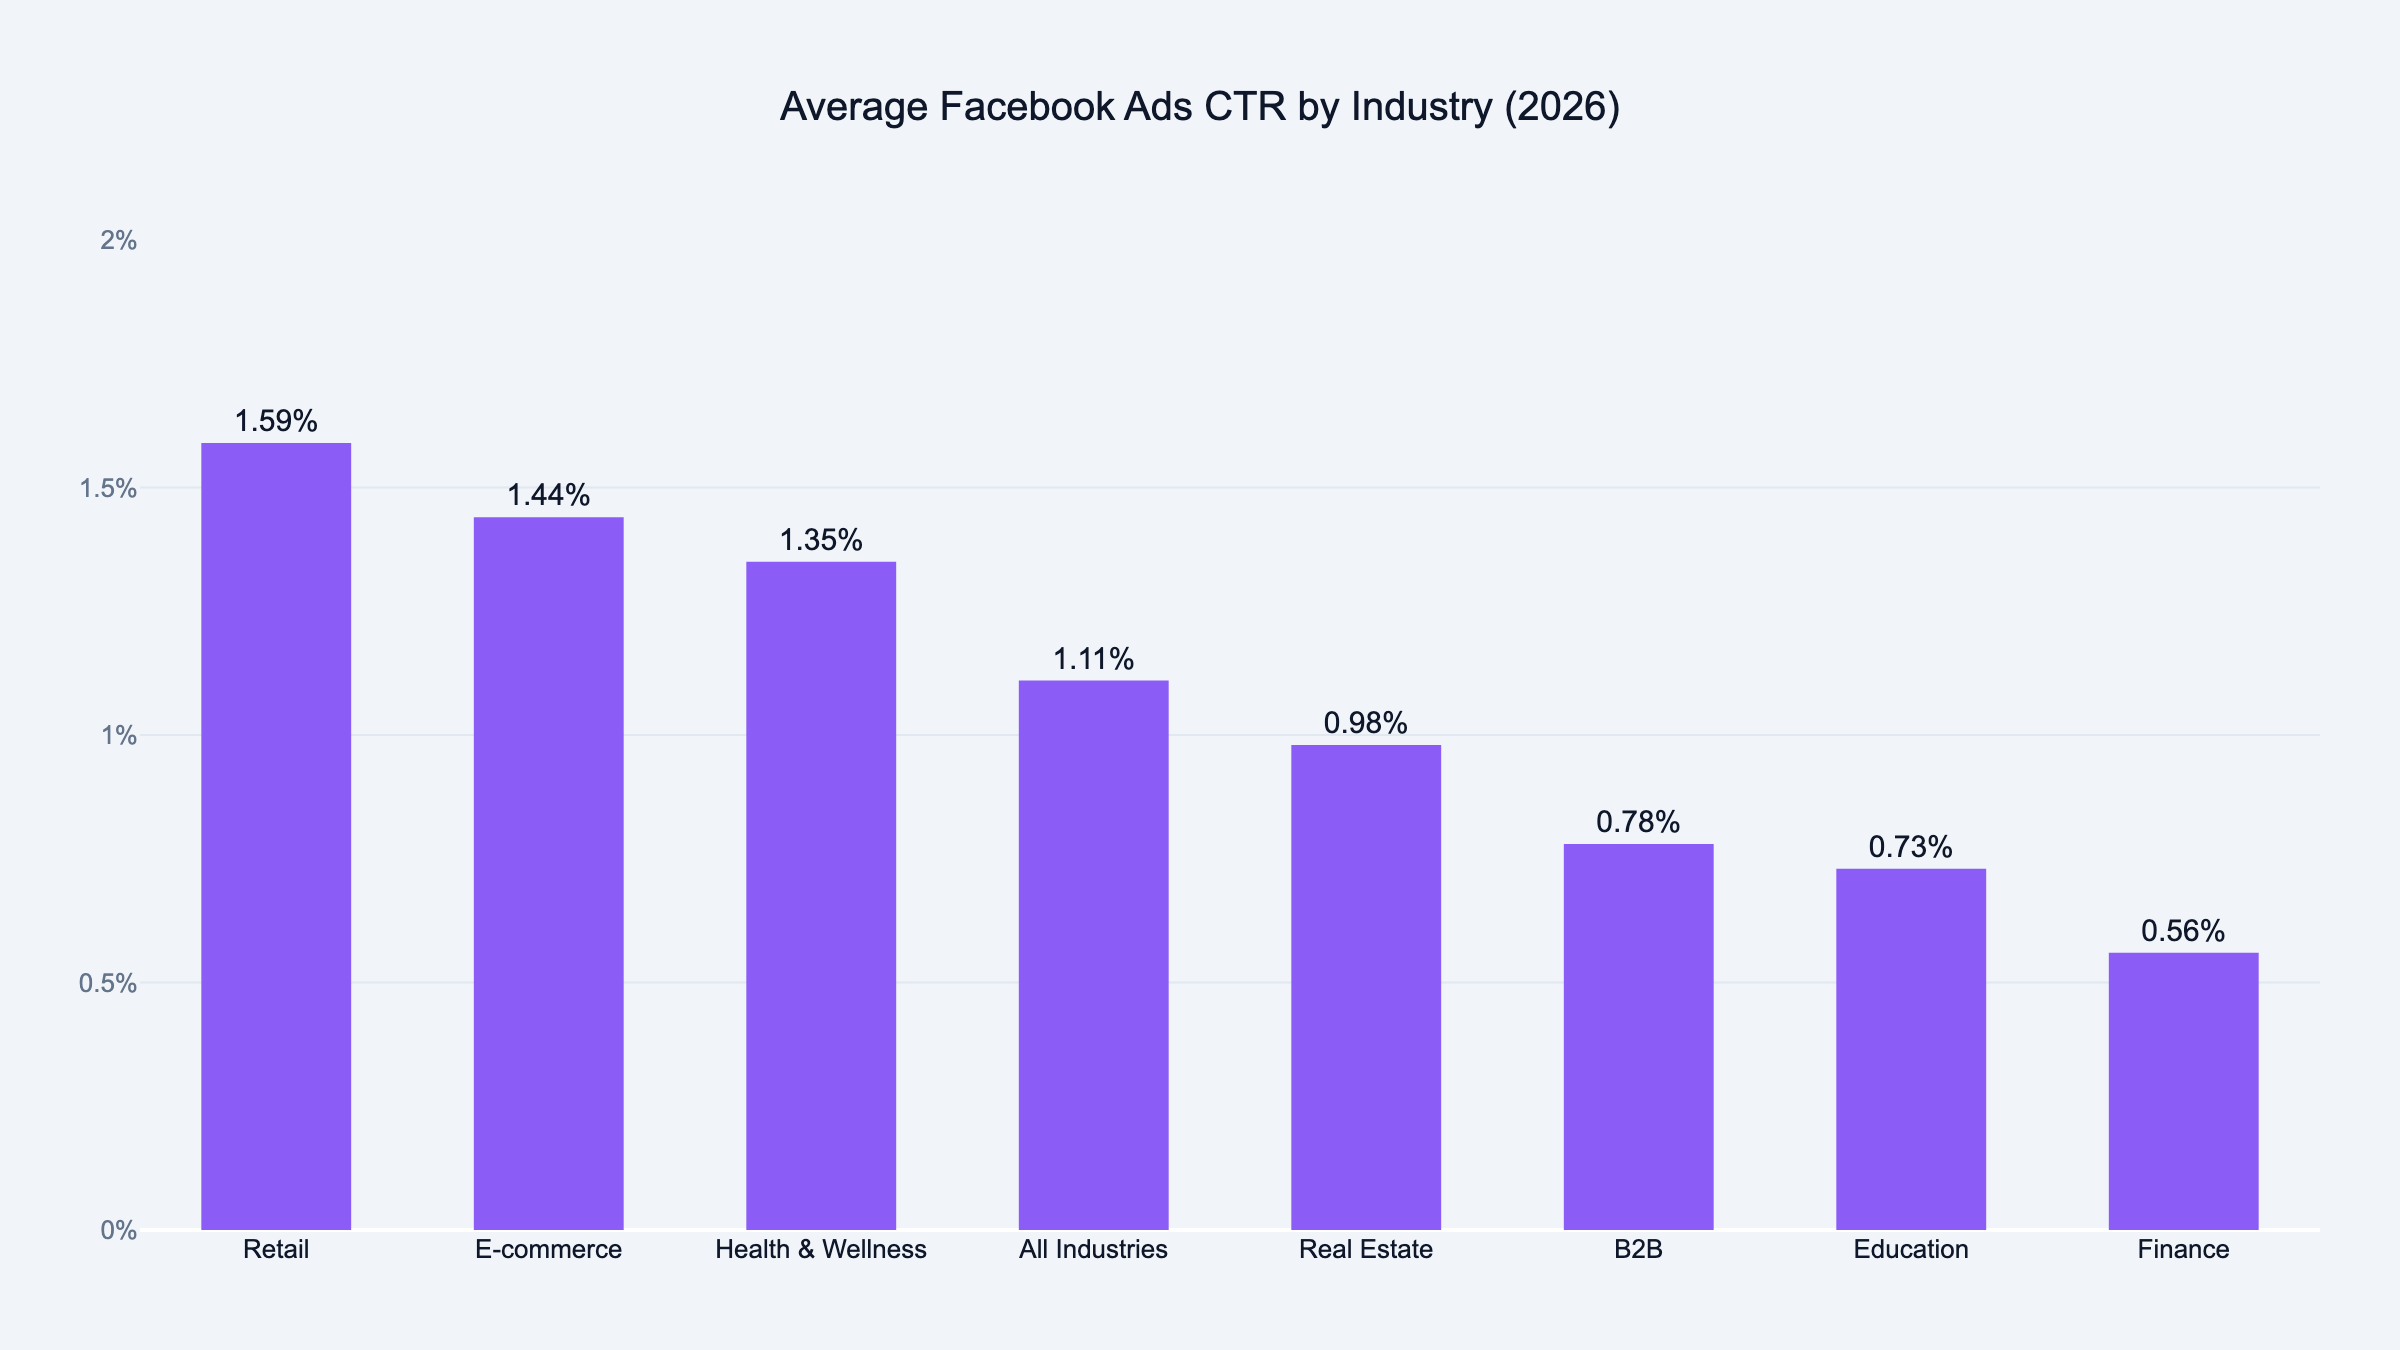
For consumer campaigns, above 1.0% is good. For B2B, above 0.7% is good. The all-industry average is 1.11%.
CTR varies significantly by industry. Retail averages 1.59% while finance averages 0.56%. Compare your CTR against your own industry, not the overall average.
What is the average CPC for Facebook Ads in 2026?
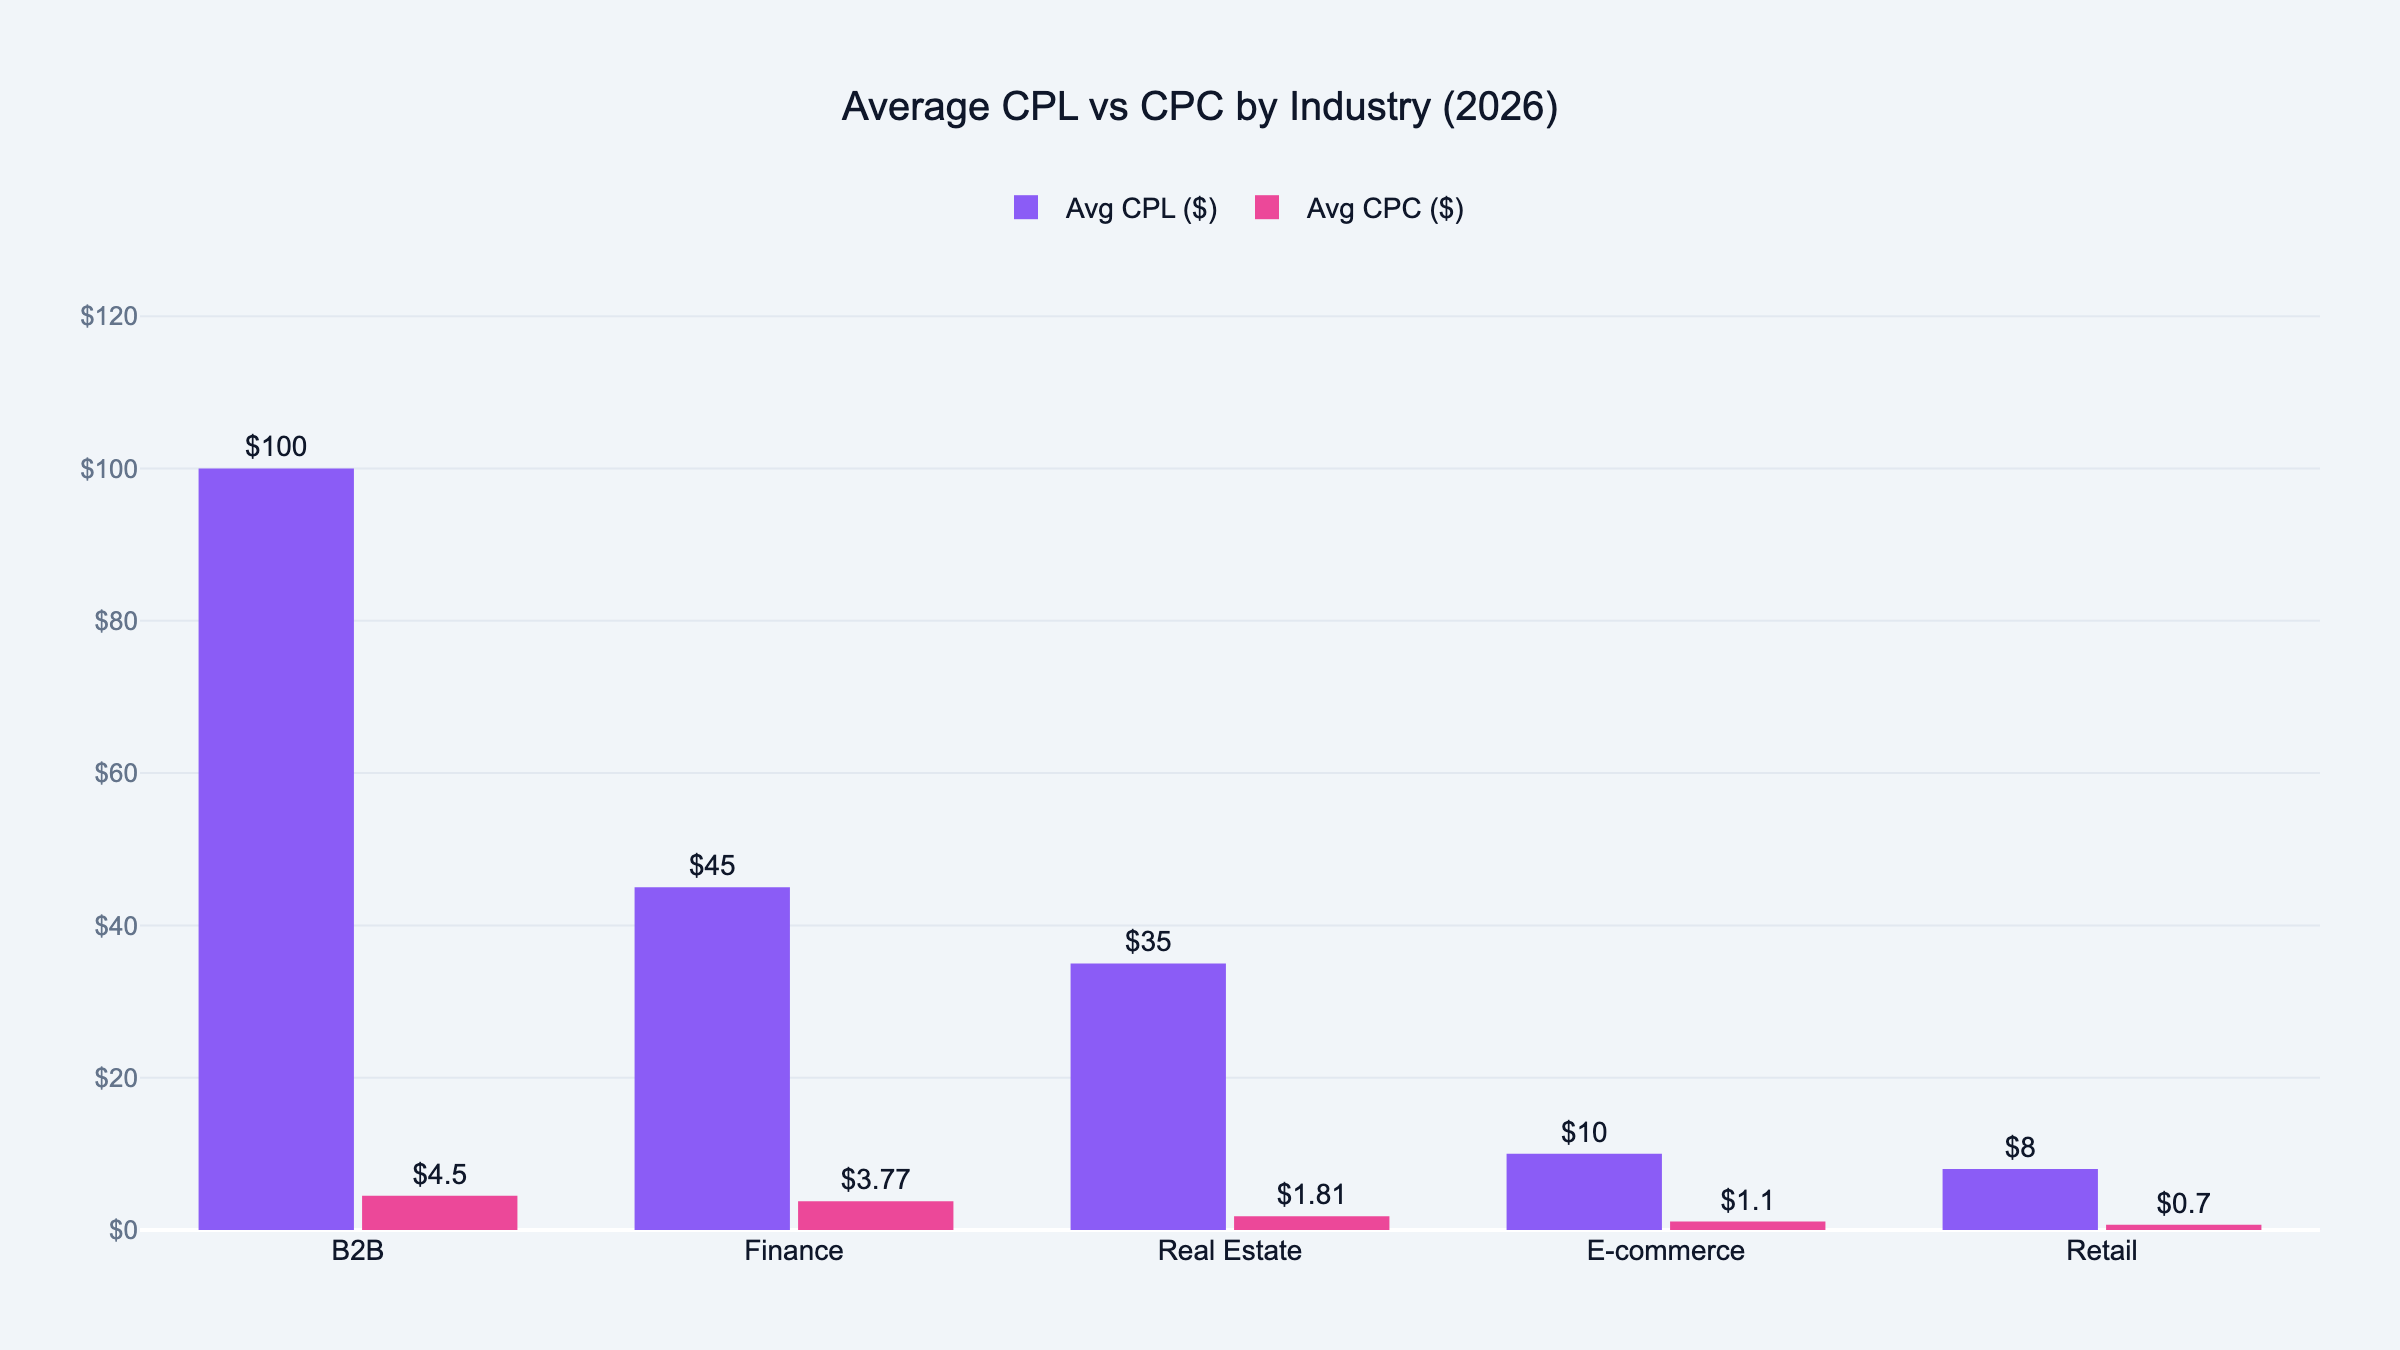
The average CPC for Facebook Ads in 2026 is $1.72 across all industries. B2B campaigns average $4.50 and retail campaigns average $0.70.
CPC depends heavily on audience size and purchase intent. Smaller, higher-intent audiences cost more per click. Industry comparison matters more than the overall average.
What is a good conversion rate for Facebook Ads?
For lead generation campaigns, the average Facebook Ads conversion rate is 9.21%. For e-commerce purchase campaigns, 2% to 4% is typical.
The right benchmark depends entirely on what conversion you are measuring. A form fill and a product purchase are not comparable metrics.
What is the average CPM for Facebook Ads?
The average CPM for Facebook Ads is $11.20 annually. It varies by season.
Q4 averages $18 to $25 due to holiday competition. Q1 drops to $6 to $9.
Budget for Q4 CPM separately. Running the same assumptions year-round will underdeliver during the holidays.
How much does a Facebook Ads lead cost on average?
The average cost per lead on Facebook Ads is $19.68 across all industries. B2B leads typically cost $50 to $150. E-commerce leads run $5 to $15.
CPL only makes sense relative to the lifetime value of a customer. A $90 lead in a business with a $5,000 average deal size is a strong lead.
What are the Facebook Ads benchmarks for B2B?
For B2B Facebook Ads in 2026: average CTR is 0.78%, average CPC is $4.50, average CPL is $50 to $150. Conversion rates run 5% to 8% for lead generation.
B2B campaigns cost more per click because the audiences are smaller and the buying intent is higher. Do not compare B2B results to general industry averages.
What are the Meta Ads benchmarks by industry?
Meta Ads benchmarks vary widely by industry. Retail sees the highest CTR at 1.59% and the lowest CPC at $0.70. B2B sees the lowest CTR at 0.78% and the highest CPC at $4.50.
Find the benchmark for your specific industry. Track your own trend over time rather than chasing a single published number.
How often do Facebook Ads benchmarks change?
Facebook Ads benchmarks shift quarterly due to advertiser competition, algorithm updates, and seasonal demand. CPM moves the most, sometimes doubling from Q1 to Q4.
Treat benchmarks as directional, not fixed targets. A campaign beating benchmark in Q1 may fall below it in Q4 simply because more advertisers are spending.
Why is my Facebook Ads CTR below benchmark?
A CTR below benchmark does not automatically mean the campaign is failing. The most important variable is which campaign phase you are in.
In the honeymoon phase, CTR is unreliable. In saturation, a dropping CTR means you have exhausted your audience.
In the scale phase, a low CTR points to creative that is not connecting. Identify the phase before diagnosing the problem.
What Facebook Ads metrics should I track weekly?
Track CTR, CPM, CPC, and CPL weekly at minimum. Compare each against the industry benchmark for your vertical and your own 30-day rolling average.
The trend matters more than any single week. A CPL that rises 10% week over week for three consecutive weeks is more meaningful than a single spike.
How do Facebook Ads benchmarks compare to Google Ads?
Facebook Ads typically show lower CTR than Google Search Ads because Facebook users are not actively searching. Google Search averages 4% to 6% CTR versus Facebook's 1.11%.
Facebook CPC is generally lower than Google Search because the intent is lower. The two platforms serve different stages of the funnel and should not share the same benchmark targets. If you are running both, see how the process for writing Google Ads copy with AI differs from Meta.
Why are my Facebook Ads not delivering?
Facebook Ads stop delivering for three reasons. The learning phase was disrupted, the audience is too small, or the bid is too low.
Check your campaign status first. If it shows "Learning limited," the ad set did not get enough conversions in the first seven days. Broaden the audience or consolidate ad sets to give Facebook more data to work with.
What is a good CPC for Facebook Ads?
A good CPC depends entirely on your industry. Retail averages $0.70. B2B averages $4.50.
Comparing your CPC against the wrong industry will give you the wrong diagnosis. The number that matters more is cost per lead or cost per acquisition. A high CPC with strong conversion can outperform a low CPC with a weak one.
What is the average ROAS for Facebook Ads in 2026?
Average ROAS on Facebook Ads runs between 2x and 4x across most industries. E-commerce typically targets 3x to 5x as a baseline.
B2B campaigns with longer sales cycles often show lower immediate ROAS. The lifetime value behind each conversion makes up the difference.
ROAS benchmarks are the hardest to generalize because they depend entirely on your margins and attribution model. Track ROAS as a directional signal rather than a fixed standard.