How Do You Stop Wasting Mondays on Reports?
You build a skill in Claude that reads your CSV exports, runs the full analysis, writes the narrative, and gives you two client-ready reports. One for your team. One for the client.
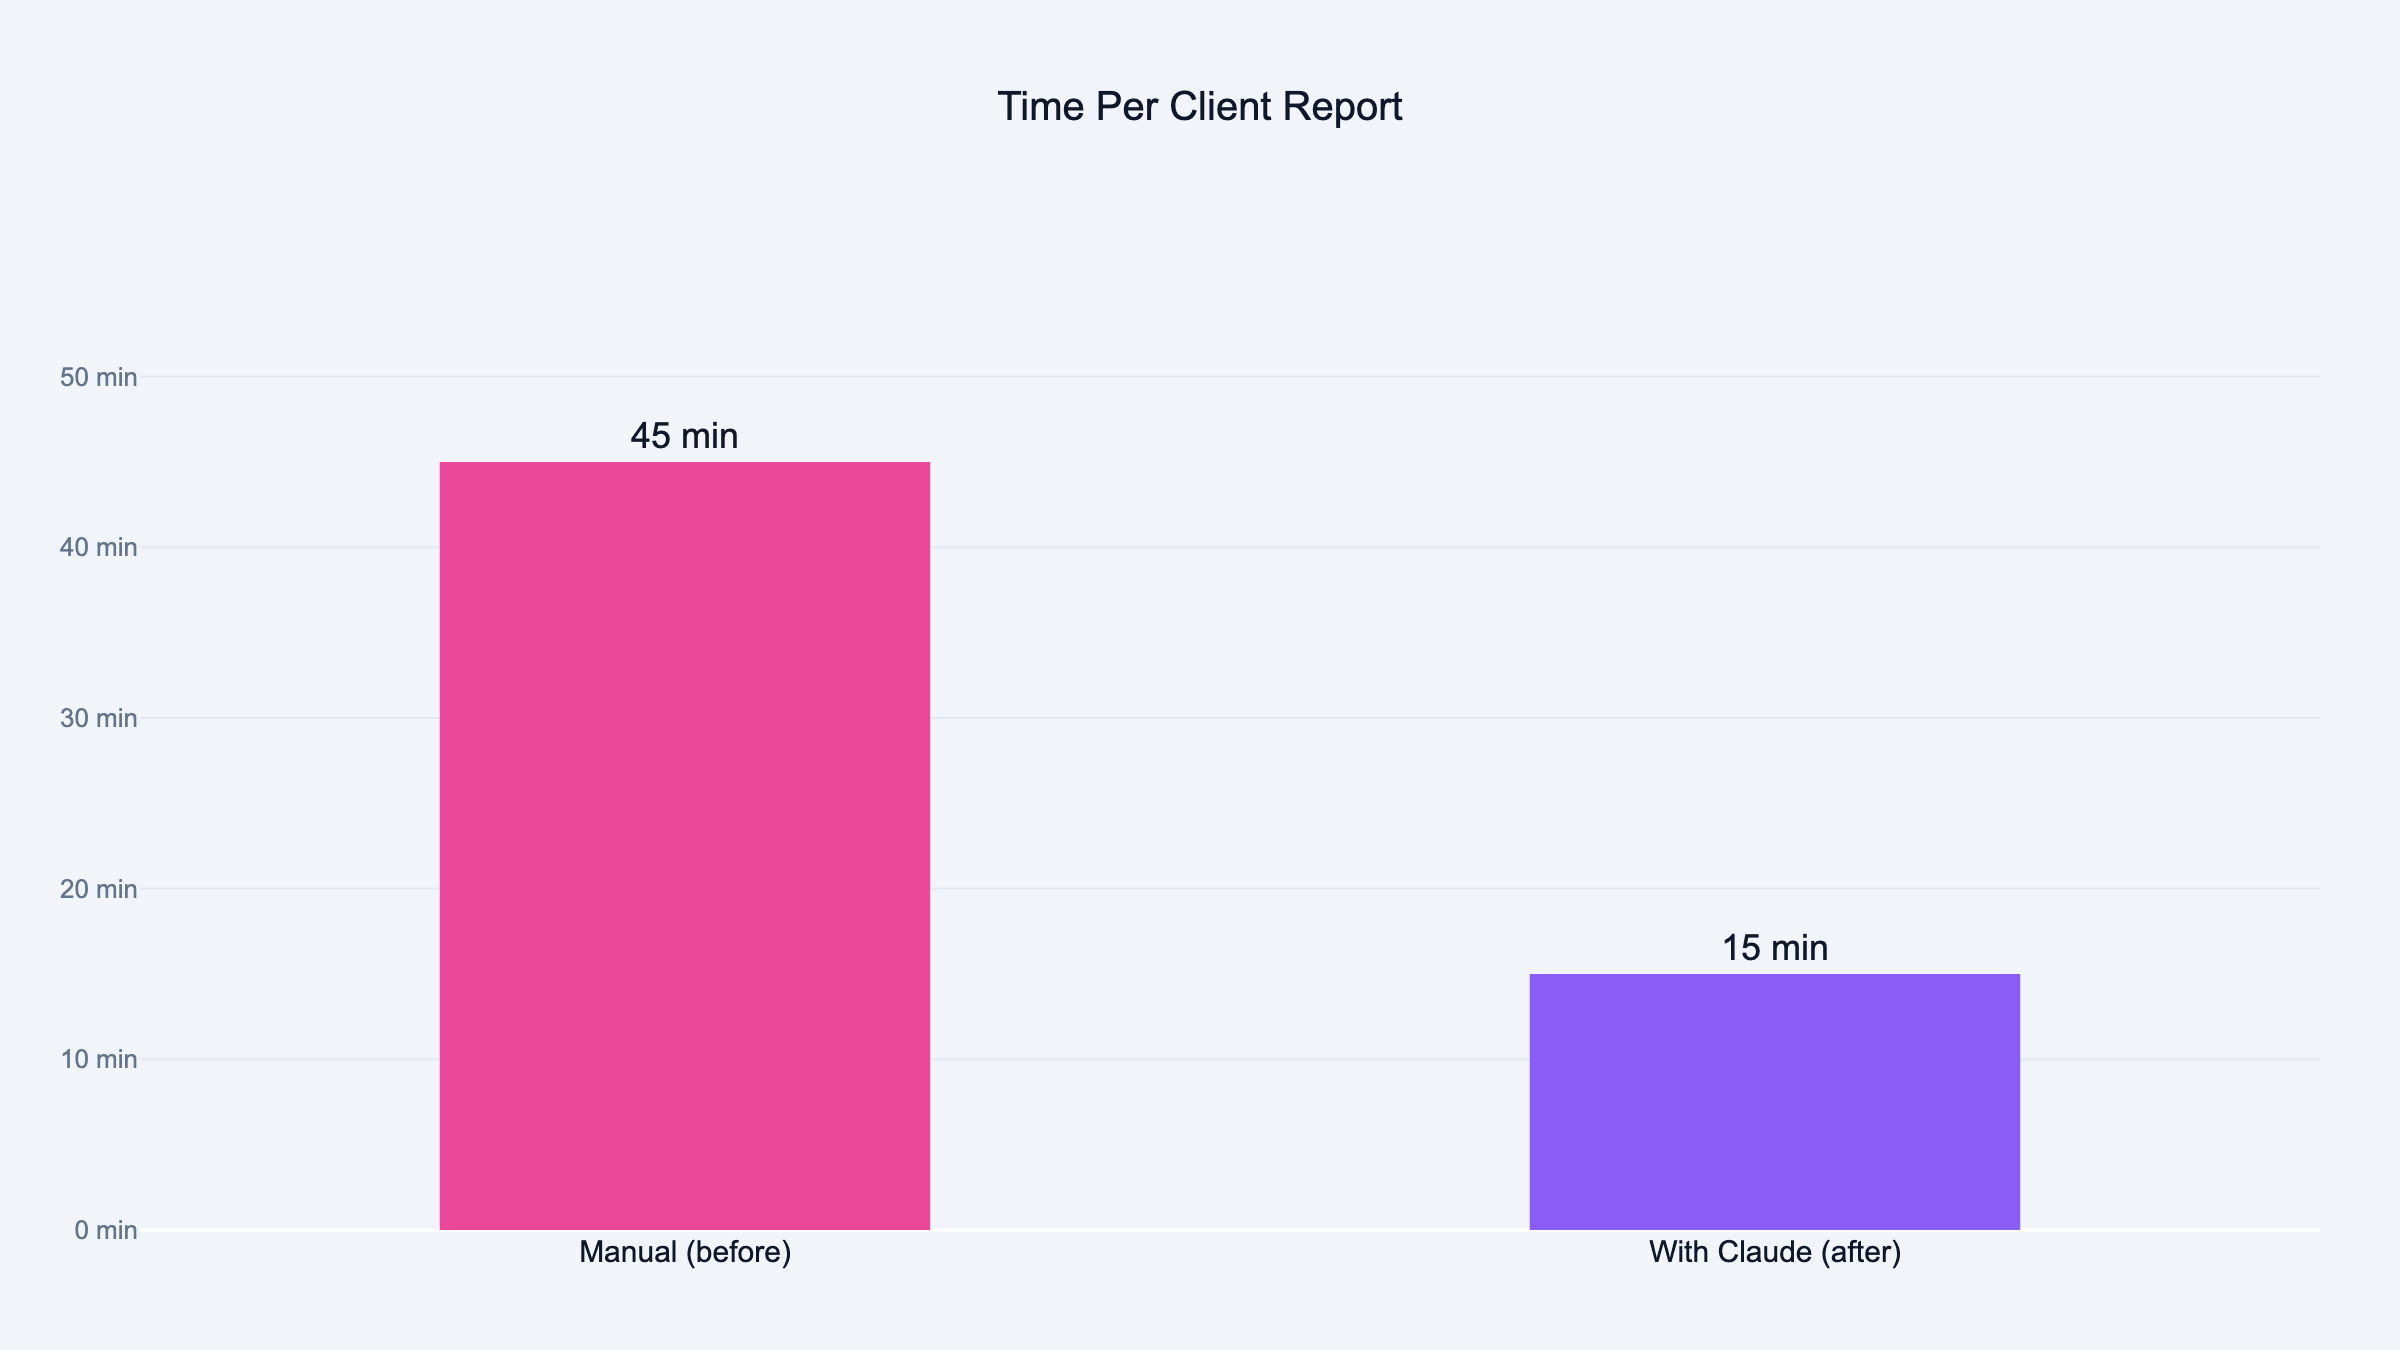
What took my co-founder a full Monday now takes fifteen minutes. Here is how I built it.
Victor Was Staring at Three Monitors
Monday morning. One screen has Meta Ads Manager open. One has a Google Sheet with last week's numbers. The third has a PowerPoint deck from two weeks ago that he is about to copy-paste into a new file and update by hand.
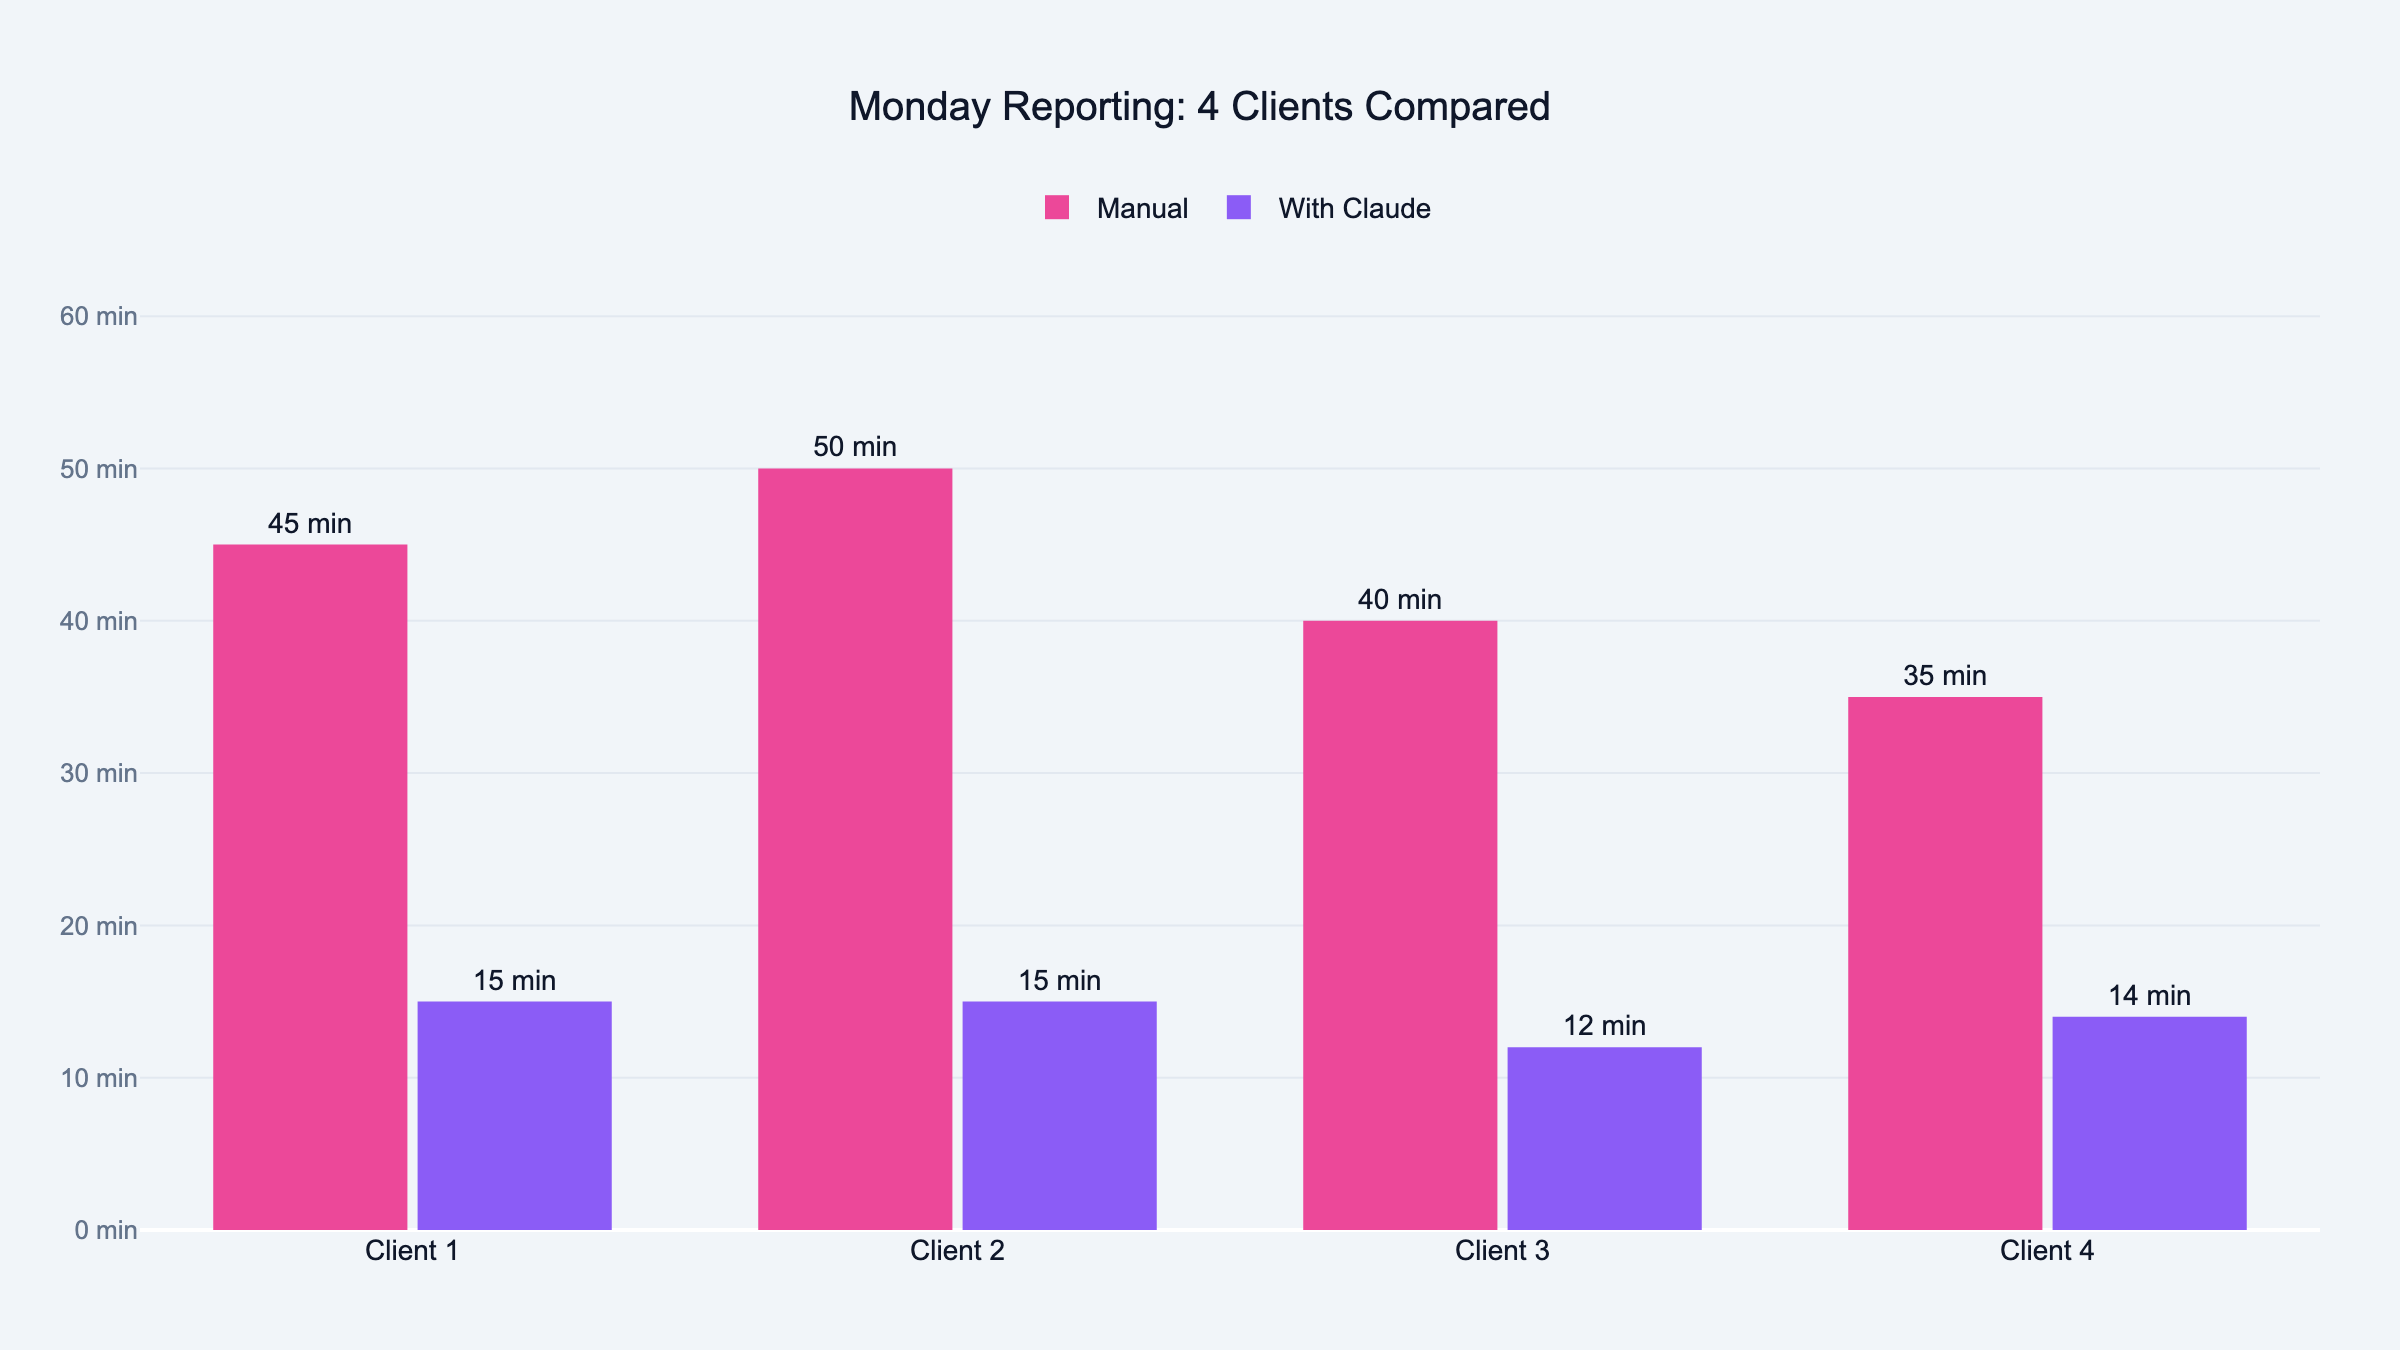
He has twelve clients. Each one gets a report. Same ritual every single Monday. Pull the data. Copy it into slides. Write the narrative. "Campaign X performed well." "We recommend increasing budget on Y." Send. Next client. Repeat.
Eight hours later he looks up from his desk and the day is gone. Not a single ad was optimized. Not one creative was tested. Not one client call was made. He spent the entire day telling people what already happened.
I sat across from him one Monday and watched. Same tabs. Same clicking. Same face. That look you get when you know you are doing something a machine should be doing but you cannot stop because the client expects it by noon.
That was the moment I decided to build the reporting skill.
CSV In, Two Client Reports Out
A skill inside Claude that reads your CSV export, runs the full analysis, writes the narrative, and outputs two client-ready HTML reports. One for your team. One for the client.
This is not a tool you download. It is something you build yourself, inside Claude, fitted to the way your agency actually does reporting. Your sections. Your metrics. Your voice.
Three Things Before You Start
Claude installed. A CSV export from Meta, Google, YouTube, or TikTok. And the knowledge of what a good report looks like at your agency.
That last one is the important one. The sections, the metrics, the narrative structure your clients expect. Every agency has a version of this floating around in somebody's head or buried in a PowerPoint template from 2019.
Step 1: Define Your Reporting Standard
I opened Claude and described what Victor puts in every report.
"I want to build a reporting skill. Here is what we include in every client report: executive summary, per-campaign breakdown with spend, CTR, CPC, CPL, and ROAS, creative performance ranking, anomaly flags, recommended actions for next week. The tone is direct. Every recommendation backed by numbers. Turn this into a PPC report template I can reuse."
Claude came back with a structured template. Sections, metric definitions, narrative guidelines.
I showed it to Victor.
He looked at it for about ten seconds, then said: "The executive summary should come after the campaign breakdown, not before. And I always add a key decisions block at the end."
Two changes. Both went into the template. The reporting standard has to come from whoever actually sends the reports. Not from a generic template. Not from me. From the person who knows what clients complain about when the format changes.
Step 2: Build the CSV Parser
This is where it gets ugly if you rush it.
"When I upload a CSV, read it, identify all columns, normalize the names. Meta and Google both rename columns depending on the export type. Calculate per-campaign totals: spend, impressions, clicks, CTR, CPC, conversions, CPL, ROAS, frequency. If a metric is missing, derive it. If it genuinely cannot be derived, flag it. Never fabricate it."
We tested this against a real Meta export and cross-checked every number against the Ads Manager dashboard. This is one of the reasons I now use Claude over ChatGPT for marketing work. Matched perfectly until we tried a monthly export instead of weekly. Meta names one column differently depending on the date range. Nobody tells you this. You find out when your CPL is suddenly off by 40% and you have no idea why.
That is the kind of silent failure that ruins trust with a client. The report looks right. The numbers look reasonable. But they are wrong, and you will not know until someone checks.
We added both column variants and tested again. Test on real exports, not sample data. Sample data does not have the naming inconsistencies that will break your parser at 9 AM on a Monday when you are trying to send reports.
Step 3: Build the Analysis Engine
Data without interpretation is a spreadsheet. The client already has a spreadsheet. What they need is somebody telling them what to do next week.
"Flag top campaigns by ROAS and conversion volume. Flag bottom campaigns by cost efficiency. Flag any campaign where spend jumped 20% or more without a lift in results. Flag zero-conversion campaigns that burned through twice the CPL target. Flag frequency fatigue. One sentence per flag explaining what happened and the numbers behind it."
The skill splits every campaign into three buckets. Scale it. Kill it. Investigate it.
A new campaign burning cash to find winners has different thresholds than a six-month evergreen campaign. A 3x frequency on a launch campaign is Tuesday. The same number on an evergreen campaign is creative fatigue and your audience is tuning out.
The skill separates launch mode from evergreen mode. Cold audiences above 3x frequency on launch campaigns get flagged. On evergreen, the threshold drops to 2x. Small difference. Huge impact on the recommendation.
We ran it against a week where one campaign had a genuine spend spike with zero performance lift. The skill caught it. The explanation it wrote matched what Victor would have written himself.
That was the first time I thought: this is going to work.
Step 4: Build the Narrative Layer
This is the step that separates a reporting tool from a reporting skill. Most PPC analytics tools give you a dashboard. Charts. Tables. Data.
Nobody reads dashboards. Clients open them, scroll for three seconds, close them, and ask you on the next call: "So how are things going?"
They want the story. What happened. Why it happened. What you are doing about it.
"Take the analysis and write a client-facing summary following the report template. Direct tone, not corporate. Every section three to five sentences. Every recommendation must include the specific numbers that support it."
"Campaign X is underperforming" is an opinion. You can write that about anything.
"Campaign X spent EUR450 with zero conversions, three times above the EUR15 CPL target" is evidence. The client reads that and understands exactly what happened without asking a follow-up question.
The skill enforces this on every recommendation. If there is no number, there is no recommendation.
I showed the output to Victor without telling him the skill wrote it. He read the account summary and said it sounded like his writing. Two campaign sections were too vague. We added the "include specific numbers" rule and reran. Passed.
Step 5: Build the HTML Output
"Format the narrative as a clean HTML report. Campaign sections in cards. Winners in green. Attention items in orange. Anomalies in red. Two versions: agency version with all metrics and technical detail, client version with plain-language insights and no raw tables."
Two versions because the internal team needs the full breakdown. Quality Score, impression share, hook rates, the lot. The client does not care about hook rates. The client cares about whether the campaign is working and what you are going to do next.
Color coding is the fastest way to comprehension. Client opens the report, sees green and orange at a glance, knows the account health before reading a single word.
First version had a table that broke on mobile. Fixed the CSS, reran, confirmed it passed the only test that matters: would I actually attach this to a client email?
Step 6: Add Calibration Questions
Without this step, the skill applies the same standard to every account. A EUR10 CPL target produces a very different report than a EUR40 CPL target on the same data.
"Before running the analysis, ask six questions: reporting period, campaign type, the client's target metric with ranges, CPC target for Google Ads, launch or evergreen mode per campaign, and whether to generate the HTML report."
Takes thirty seconds to answer. Changes everything about the analysis. The skill also auto-detects market codes in ad set names. If you are running campaigns across US, UK, and EU, it groups the analysis by market and asks whether the goal is the same or different per region.
Step 7: Package the Skill
"Package everything into one skill file. Include the main instruction file, platform reference files for Meta, Google, YouTube, and TikTok, and the HTML report template."
Now it is a single file. Load the skill. Drop in a CSV. Answer six questions. Get two reports.
The platform reference files matter because each platform has different metrics. Meta has hook rate and hold rate. Google has Quality Score and impression share. TikTok has 2-second and 6-second hook rates. YouTube has skip rate and completion rate quartiles. The skill loads the right reference file based on which platform it detects in the CSV columns.
Victor still uses it every Monday. The difference is he is done by 9:15.
Full Flow From CSV to Client Email
The full flow from CSV to client-ready report:
-
Upload CSV exports from Meta, Google, YouTube, or TikTok
-
Auto-detection of platform from column headers
-
Six calibration questions for period, campaign type, goals, and mode
-
Column normalization and metric calculation across all naming variants
-
Per-platform analysis with scale, kill, or investigate verdicts backed by numbers
-
Creative scoring per ad with a 0-10 score and adaptive weights
-
Cross-platform comparison if two or more platforms present
-
Full narrative report following your template
-
Two HTML reports for agency and client audiences
Edge cases that will save you debugging time: multi-market grouping from ad set naming conventions. Missing metrics derived where possible, flagged where not, never fabricated. Budget pacing only checked on three or more days of data. Cross-platform comparison only runs if date ranges actually overlap. Launch vs evergreen thresholds applied per campaign, not globally.
Test with actual client CSV formats before building the parser. Meta and Google change their export columns regularly. I found three naming variations after I thought I was done. More aggressive normalization on day one would have saved two debugging sessions.
Separate metric calculation from narrative generation earlier. When both break at the same time, you cannot tell which step failed. Build each step on its own, test it, then connect them.
Frequently Asked Questions
Meta Ads Manager, Google Ads, YouTube Ads, and TikTok Ads. The skill detects the platform from column headers in your CSV. No API keys needed.
Do I need to know how to code?
Not at all. Every step in this article is a plain language prompt you type into Claude. Copy it, paste it, adjust it for your agency.
How long does the full build take?
About 30 minutes for the basic version with analysis and narrative. Another 30 if you want the HTML output with color coding and dual versions.
Can I use my own report template?
That is the entire point. Step 1 is defining your template from whoever actually sends reports at your agency.
What if my CSV is missing columns?
The skill derives metrics where possible. Frequency from impressions and reach. CTR from clicks and impressions. If a metric genuinely cannot be calculated, it flags it. It does not invent numbers.
Does it work with multiple clients?
Victor runs it for 12 clients every week. Each one gets calibrated separately through the six questions. Different goals, different thresholds, different reports.
How accurate is the analysis compared to manual?
I cross-checked every metric against the Ads Manager dashboard during testing. The numbers matched. The narrative quality depends on your template. If your template is vague, the output is vague.
If you upload CSVs from two or more platforms, it runs a cross-platform comparison. CPL and ROAS side by side with a budget reallocation recommendation. It validates that date ranges overlap first.
What is launch mode versus evergreen mode?
Launch mode assumes the campaign is new and spending aggressively. Higher frequency thresholds, volume-focused benchmarks. Evergreen mode assumes the campaign is mature. Tighter limits, efficiency-focused benchmarks.
Can I change the HTML report design?
The report uses HTML and CSS. Changing the template prompt changes the output. Colors, fonts, layout, which sections appear. All adjustable.